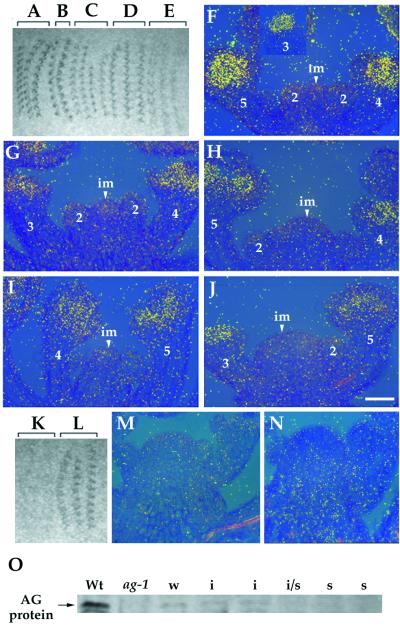
Figure 3.
Effects of AG dsRNA on levels of AG mRNA and AG protein. (A–E) An autoradiogram of the tissue hybridized with an AG anti-mRNA probe. The tissue is from wild-type (A and F), weak (B and G), intermediate (C and H), intermediate/strong (D and I), and strong (E and J) AG (RNAi) mutant plants. (A–E) Hybridization signals declined gradually with increasingly severe phenotypes. (F–J) The bright-field/dark-field double exposures of longitudinal section through the inflorescence meristems with stage 2–5 flowers. The silver grains representing AG mRNA expression were made to appear yellow with the use of a yellow filter. The number indicated corresponds to the development stage of flowers (43). im, inflorescence meristem. (Bar = 50 μm.) (K and L) An autoradiogram of the tissue hybridized with an AG sense probe. The tissue is from wild-type (K and M) and intermediate AG (RNAi) mutant plants (L and N). (O) Western blot analysis of AG protein. The anti-AG antibody recognizes the carboxyl-terminal part of the AG protein from aa 220–285 which is absent in the AG-1 protein (27, 42); thus, ag-1 is a control of the specificity of the antibody. Whereas AG protein is weakly expressed in weak (w) and intermediate (i) AG (RNAi) mutants compared with wild type (Wt), it is not detected at levels above background in intermediate/strong (i/s) and strong (s) AG (RNAi) mutants.

