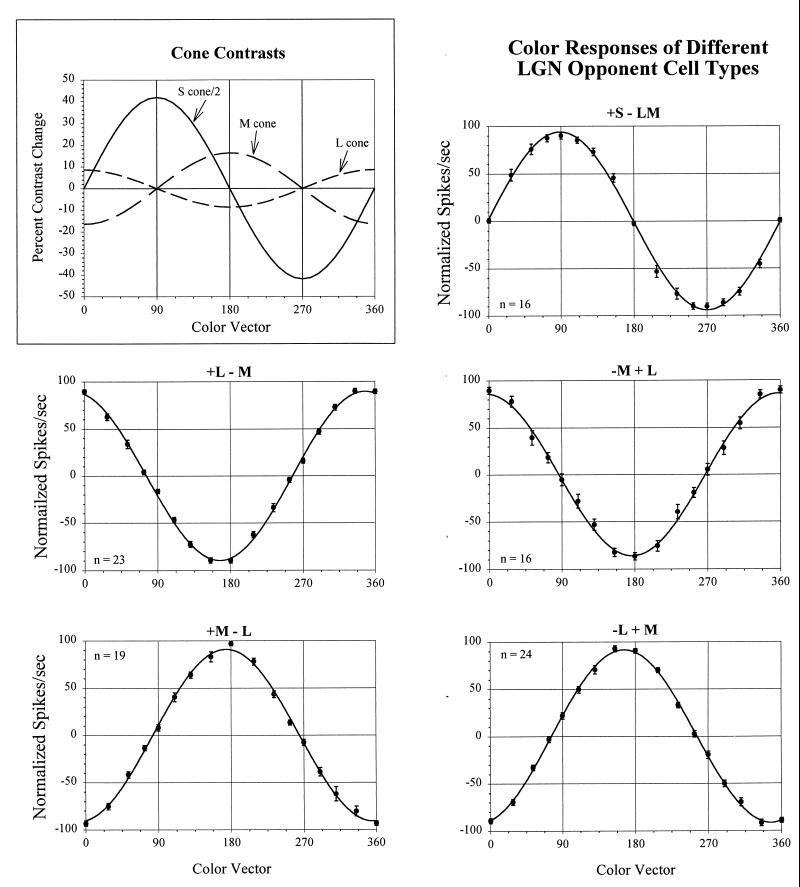
Figure 1.
The cone contrasts produced by stimuli of different color vectors and the responses of LGN cells to these patterns. (Inset) The changes in cone contrast produced by the shift from the background white to the stimuli along different color vectors. Note that the variations in contrast for each cone type are sinusoidal functions of the color vector. The other panels show the average normalized responses (+/− 1 SE) of each of the different LGN opponent cell types, fit with sinusoids. (Positive and negative spikes/second refer to responses to opposite phases of the stimuli, respectively). The cell types are designated in terms of the cone inputs to center and surround of their receptive fields, with + and − referring to activation in response to increments and decrements, respectively. Note that the L/M opponent cells peak close to the 0°-180° MBDKL axis, although the cells with L-cone centers are somewhat off this axis. Note that the responses of +S-LM cells align precisely with the 90°-270° axis. In this cell sample, only two −S + LM (not shown) cells were found.

