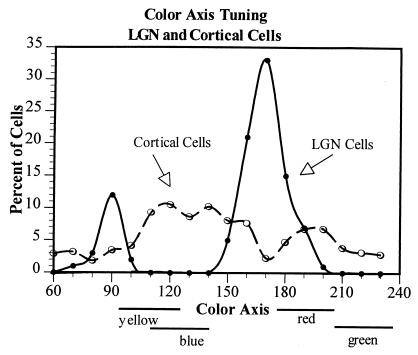
Figure 2.
The distribution of color axis tuning of a population of 100 LGN cells and 314 cells in striate cortex. The data from cells tuned to opposite phases along a given color axis have been combined, so for instance 90° = 90° + 270°. Note that LGN cells are clustered around the L/M (0°-180°) and the S-LM (90°-270°) axes in their color tuning, as was also shown in Fig. 1. Striate cortex cells, on the other hand, are tuned to all of the various chromatic axes, with a slight tendency, however, to be tuned off the LGN axes, and thus more in the regions of the perceptually unique hues, which are also off the LGN axes.

