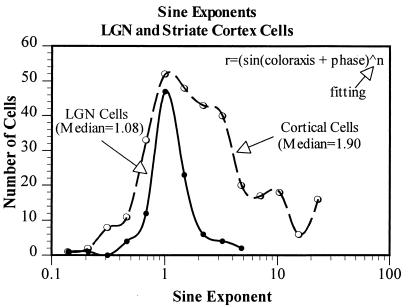
Figure 5.
The distribution of best-fitting exponents to the color-tuning data from all of the LGN and striate cortex cells. LGN cells are quite linear and thus their data are fit with sinusoids of exponents close to 1, that is, with a sine wave. Some striate cortex cells show similar linear responses, but approximately one-half are best fit with sinusoids to higher powers, indicating an expansive nonlinearity (with consequent narrower color tuning). The median best-fitting exponent for the color responses of the LGN cells is 1.08 and for the striate cortex cells it is 1.90.

