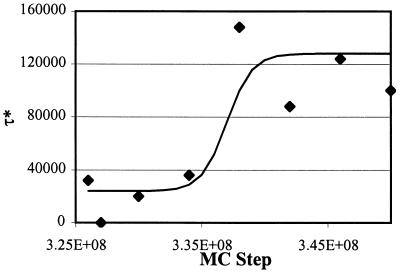
Figure 5.
Growth of the relaxation time (τ*) in the statistically pattern-matched region for loops of length 26. The points correspond to simulation results; the solid line is meant only to guide the eye. τ* is calculated to be the time when 〈P26(t) P26(t + τ)〉 has decayed to 5% of its final value. τ* in the wrong regions of the surface are not reported because the adsorbed states are not sufficiently long to extract meaningful values of τ* (which, in effect, is zero).

