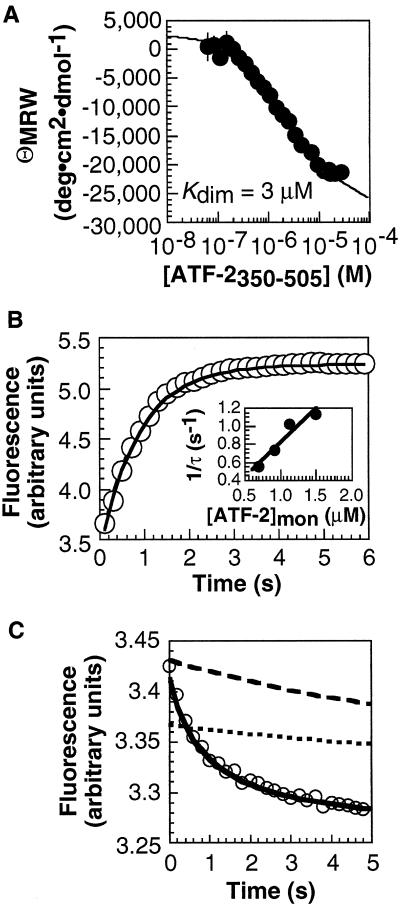
Figure 2.
Analysis of ATF-2350–505 monomer–dimer equilibrium and kinetics and [ATF-2350–505]2⋅CRE24 association kinetics. (A) ATF-2350–505 monomer–dimer equilibrium analyzed by CD. (B) ATF-2350–505 monomer–dimer kinetics analyzed by stopped-flow fluorescence spectroscopy. A solution of [ATF-2350–505]Total = 30 μM was diluted 10-fold, and the fluorescence was monitored as a function of time. (Inset) Relaxation rate as a function of [ATF-2350–505]monomer. (C) [ATF-2350–505]2⋅CRE24 association kinetics analyzed by stopped-flow fluorescence spectroscopy. A 200-nM solution of ATF-2350–505 was mixed rapidly with 100 nM CRE24, and the fluorescence was monitored as a function of time. The relaxation rate (1/τ) was determined from the fit to a single exponential. Simulations of binding of CRE24 by ATF-2350–505 via the monomer (solid line) and dimer pathways are shown. The concentration of [ATF-2350–505]2 at the start of the simulation along the dimer pathway was defined either by the ratio k−3/k3 determined by fluorescence (dotted line) or by Kdim determined by equilibrium CD measurements (dashed line). In neither case can the dimer pathway account for the rate of DNA binding.

