Figure 3.
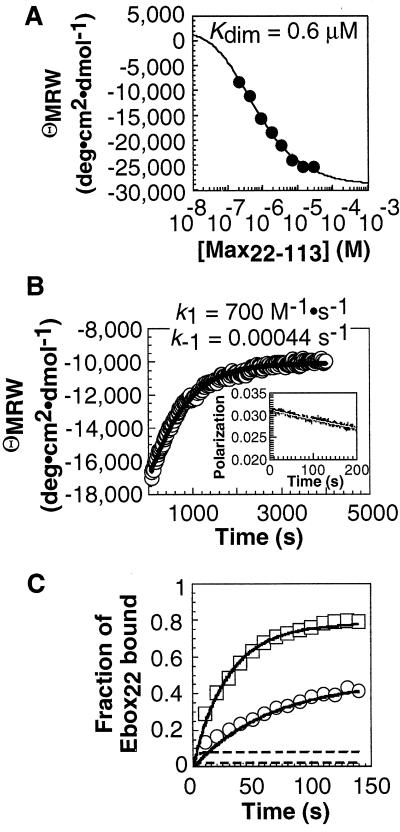
Analysis of Max22–113 monomer–dimer equilibrium and kinetics and [Max22–113]2⋅Ebox22 association kinetics. (A) Max22–113 monomer–dimer equilibrium analyzed by CD. (B) Max22–113 monomer–dimer kinetics analyzed by CD and stopped-flow fluorescence. A 50-μM solution of Max22–113 was diluted 50-fold into PBS buffer at 25°C, and the negative ellipticity at 222 nm was monitored as a function of time. (Inset) Max22–105SFlu monomer–dimer relaxation kinetics monitored by stopped-flow fluorescence polarization within the first 200 sec of the reaction. A solution of 5 μM Max22–105SFlu was diluted 10-fold into PBS buffer at 25°C, and the fluorescence anisotropy was monitored as a function of time. (C) Association of 1 nM (○) and 2 nM (□) Max22–113 with 50 pM Ebox22 at 25°C. Each point represented the average of at least three independent experiments. Error bars shown represent the SD. Similar association kinetics were observed with a 135-bp DNA fragment containing a single Ebox site (CACGTG). Simulations of binding of Ebox22 by Max22–113 via the monomer (solid lines) and dimer (dashed lines) pathways are shown.

