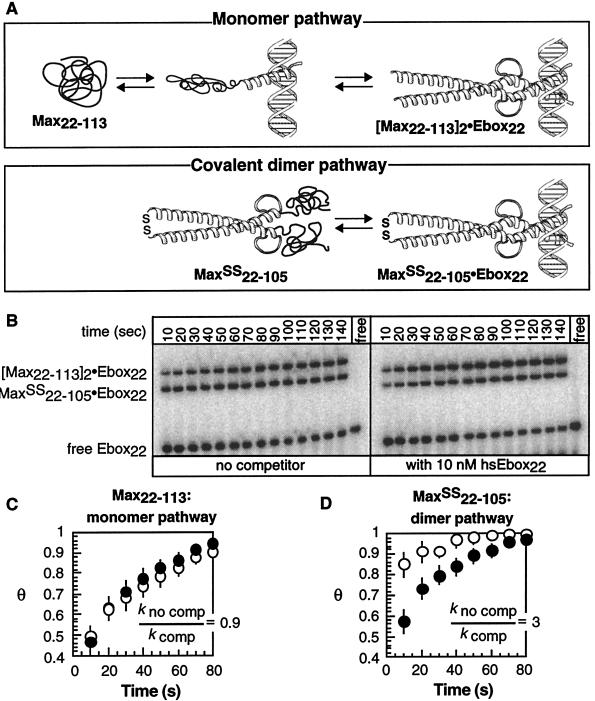
Figure 4.
Comparison of the rate of DNA binding through the monomer and dimer pathways in the presence and absence of excess nonspecific competitor DNA. (A) Scheme illustrating the monomer-binding pathway utilized by Max22–113 and the covalent dimer pathway utilized by Max22–105SS. (B) Phosphorimage illustrating the relative rate of [32P]Ebox22 binding by Max22–113 and Max22–105SS in the presence or absence of competitor hsEbox22. The fraction of DNA bound (Θ) by either Max22–113 (C) or Max22–105SS (D) at each time point in the absence (○) or presence (●) of hsEbox22 DNA was normalized to a value of Θ = 1 at equilibrium and fit to a single exponential to give values of kno comp and kcomp, respectively. Each point represented the average of at least four independent experiments. Error bars represent SE.

