An official website of the United States government
Here's how you know
Official websites use .gov
A
.gov website belongs to an official
government organization in the United States.
Secure .gov websites use HTTPS
A lock (
) or https:// means you've safely
connected to the .gov website. Share sensitive
information only on official, secure websites.

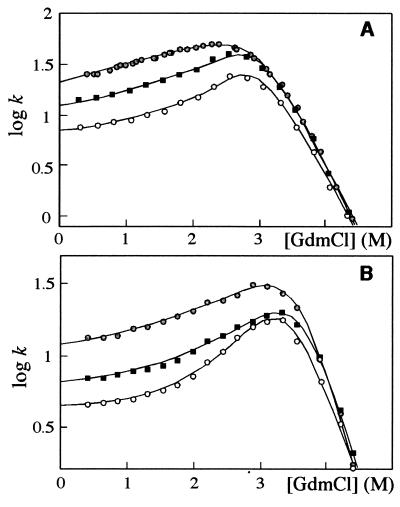
 ), VA85 (○), and EQ22 (■) in 1 M Na2SO4 (A) and 1.25 M Na2SO4 (B). At 1 M Na2SO4, wild-type data were fitted to the dead-end model (Scheme