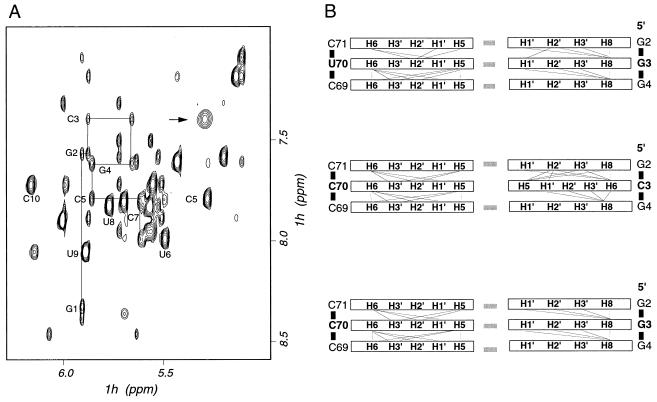
Figure 5.
(A) Region of the NOESY spectrum of the C-C minihelix containing signals from base and anomeric RNA resonances. Data were collected at 27°C in 10 mM phosphate buffer (pH 6–6.5) and 300-ms mixing time. Resonances belonging to nucleotides at the 5′ end of the minihelix are connected by a thin line to explicitly show sequential NOE connectives that were used to obtain spectral assignments. The broad base H5-H6 resonance of cytosine C3 is indicated by an arrow. The resonance of C70 overlaps other resonances at this temperature. However, the broad H5-H6 resonances of C70 was observed at a lower temperature. (B) Schematic diagram of NOE connectivities patterns observed for G⋅U, C-C, and G⋅C minihelices. Hydrogen bonding between base pairs is indicated by gray rectangles.

