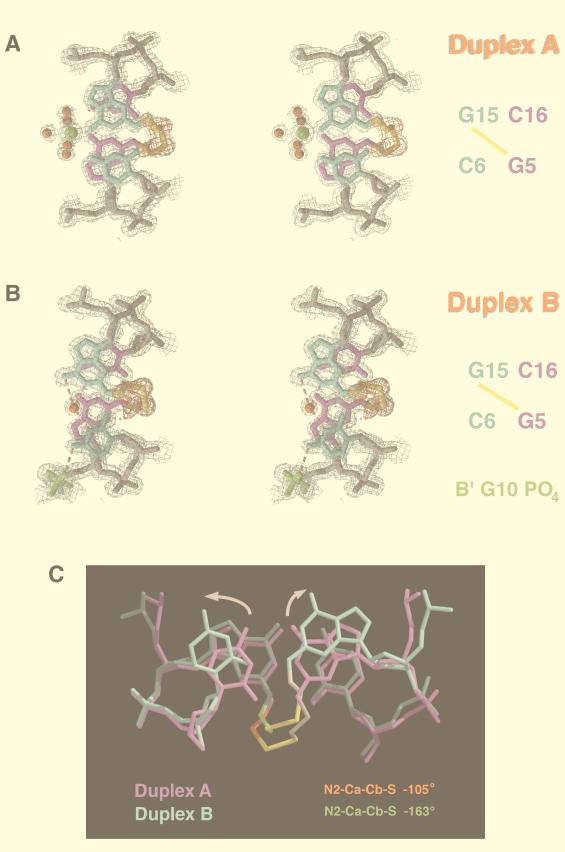
Figure 3.
Stereo views of the structure of the middle two base pairs, the crosslinks (yellow), and the calcium (green) ion for duplexes A (A) and B (B). Also shown is the phosphate (green) on a symmetry related duplex B, which interacts with the partially flipped-out cytosine of duplex B. Final 1.0σ 2Fobs − Fcalc maps are shown in light blue. The 2.5σ Fobs − Fcalc map just before including the crosslinks in the model is shown in red. Water molecules discussed in the text are shown as red spheres. Hydrogen bonds (under 3.5 Å) are drawn for the water in duplex B. (C) A superposition of the two crosslinked base pairs from duplex A in magenta and duplex B in cyan with the crosslinks in gray and yellow for the sulfurs. The nearly eclipsed bond in the A crosslink is shown in red, and the same bond in its staggered conformation in the B crosslink is shown in green. The corresponding torsion angles are noted as well. The arrows depict the swiveling of the bases in duplex B from a standard conformation in A.

