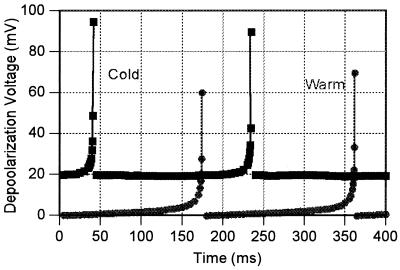
Figure 1.
Typical segments of the variation of the transmembrane potential of the sensory fingers as a function of time as calculated from Eqs. 1-7 with the parameters discussed here. The cold sensor variation is off-set by 20 mV for clarity. The solid lines at the pulse are to guide the eye. Each plot is calculated for the “neutral” temperature of ≈37°C, where the two frequencies are about the same.

