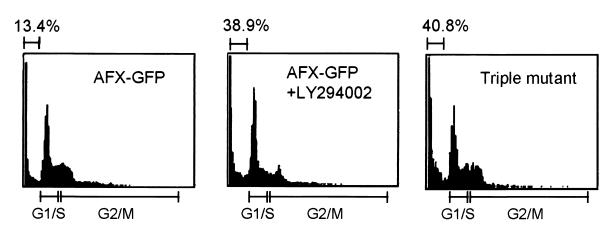
Figure 5.
Flow cytometry of CHO-K1 cells. CHO-K1 cells expressing AFX-GFP or triple mutant were used. Where indicated, the cells were treated with LY294002 at 20 μM for 24 h. DNA distribution was analyzed by flow cytometry, and the cell fractions in G1/S and G2/M phases are indicated at the bottom. The numbers on top indicate the percentages of the cells containing sub-G1 DNA. Results shown are representative of three independent experiments.

