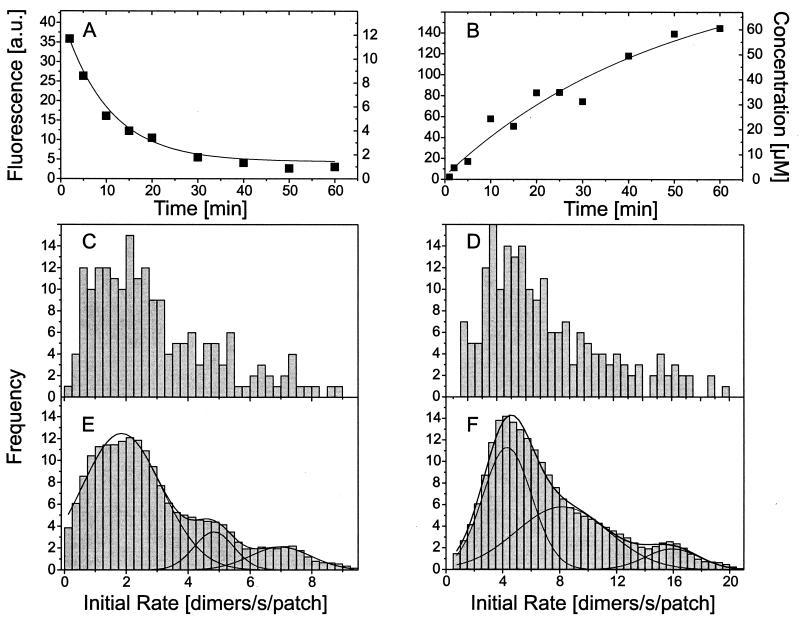
Figure 4.
Protein transport rate of the NPC. (A and B) From confocal scans as shown in Fig. 1 C and D the time-dependent fluorescence of single-filter pores was derived. Fluorescence was converted into concentration and fitted by a simple exponential. The fit was used to derive the initial rate and, taking the volume of the filter pore into account, expressed in molecules/s per patch. (C–F) Populations of transport rates were plotted as frequency diagrams where C and D are the raw data, and E and F are smoothed data. The peaks that are equidistantly spaced on the abscissa represent membrane patches with one, two, or three NPCs.

