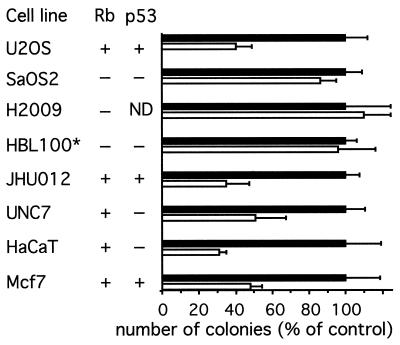
Figure 1.
Growth suppression by BRCA1. Cells were transfected with equimolar amounts of pcDNA3-BRCA1 or vector alone and selected with G-418; emerging colonies were stained and counted. The number of colonies obtained with the vector alone was considered as 100%. pRb and p53 status of cells is shown. Each experiment was repeated at least three times, and error bars represent standard deviation. ■, vector alone transfections; □, BRCA1 transfections. ∗, HBL100 cell line is SV40-positive; ND, not done.

