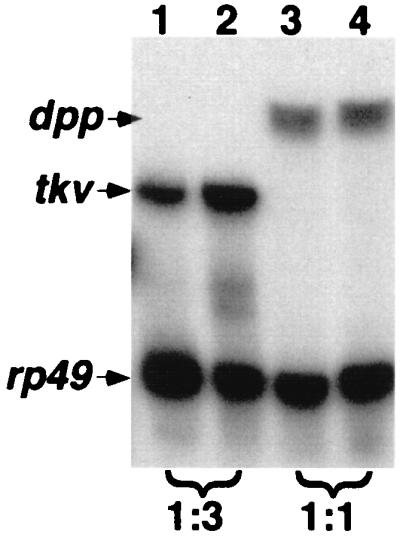
Figure 4.

Quantitation of tkv RNA expression. Total RNA was isolated from ovaries of Oregon-R (lanes 1 and 3) or D-mef265/D-mef2424 (lanes 2 and 4) females. S1-nuclease protection assays were performed as described in Materials and Methods. rp49 serves as internal controls. The intensity of the bands were quantitated by using a PhosphorImager. The densities of the tkv and dpp bands were normalized against those of rp49 from the same sample, and the relative values (wild type/D-mef2−/−) are indicated at the bottom.
