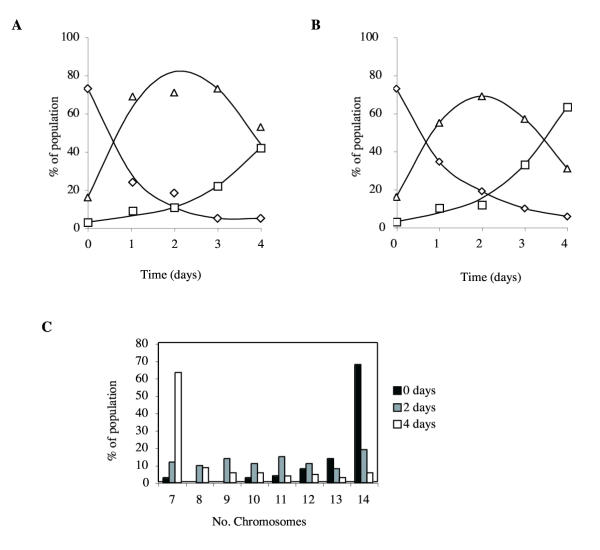
Figure 4.
Segregation of diploids. Diploid cells were grown in axenic medium in the presence of (a) 10 μg/ml benomyl and (b & c) 5 μg/ml thiabendazole. DIR1 cells were grown for the times indicated in axenic medium supplemented with thymidine and uracil. Ploidy was measured by cytological staining and scoring 100 cells for chromosome number. Diamonds indicate diploid cells, squares indicate haploid cells, and triangles indicate aneuploids. Note that the true level of aneuploidy is overstated because of overlaps between chromosomes in the diploid images.

