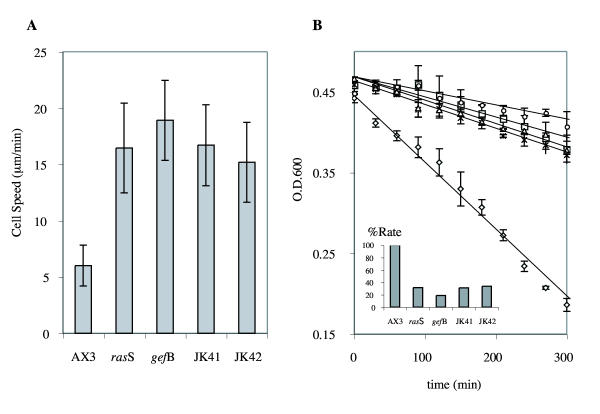
Figure 7.
Relative rates of (a) motility and (b) phagocytosis of rasS-, gefB- and double mutant strains. Rates of phagocytosis were determined by the decrease in optical density of a bacterial suspension as bacteria are removed. The rate of phagocytosis relative to wild-type cells is plotted in the inset. Motility values are the means ± SD of 10 cells. OD values are the means ± SD of triplicate experiments.

