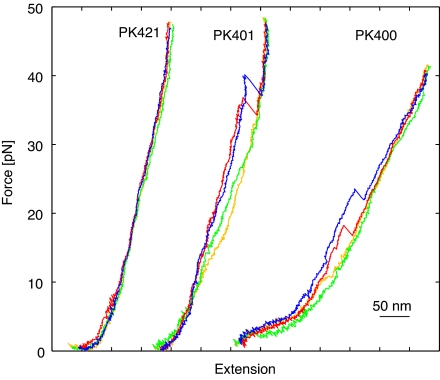
Fig. 4.
Stretch and relax curves of single molecules. Force and change in extension were measured in several cycles of stretching and relaxing of a single molecule. Here, data from two cycles are shown for pseudoknot containing RNA, PK400 and PK401, and for the no-pseudoknot control PK421. Red, first stretch; yellow, first relax; blue, second stretch; green, second relax.

