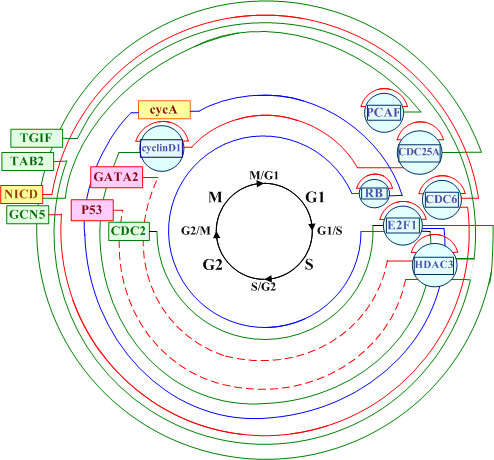
Figure 5.

Some experimental results of regulatory modules for human cell cycle data set. The green lines indicate regulatory connections predicted by this approach. The red lines indicate regulatory connections that predicted by this approach and also are confirmed by biological experiments. The red dotted lines represent the negative regulatory controlling. The blue lines shown in this graph demonstrate the feed-forward controlling between E2F1, RB and the target gene cycA. All TFs are represented by blue circles and the squares indicate the target genes.
