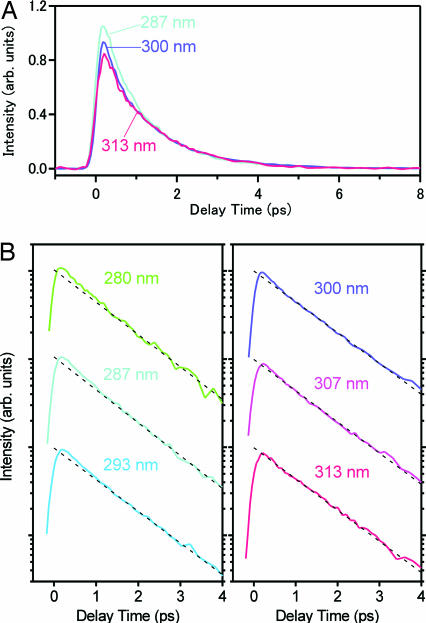
Fig. 6.
Comparison of the temporal changes of the dimer fluorescence. (A) Linear plot of the temporal changes of the dimer fluorescence obtained with 287-, 300-, and 313-nm excitation. (B) Logarithmic plot of the temporal changes of the dimer fluorescence for the six excitation wavelengths. The dotted straight line drawn for each trace corresponds to the 1.1-ps single exponential decay.

