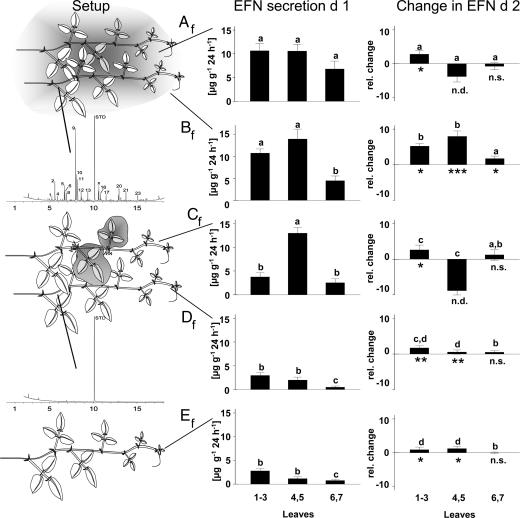
Fig. 2.
Induction and priming of EFN secretion by volatiles (experiment 2). (Left) The experimental setup with receiver tendrils being exposed (Bf) or not exposed (Df) to VOCs of artificially induced emitter tendrils (Af and Cf) and the respective GC profiles are displayed. (Center) EFN secretion (in micrograms of soluble solids secreted per gram of leaf dry mass and 24 h +SE) of different leaf age classes (leaves 1–3, leaves 4 and 5, and leaves 6 and 7) on day 1. (Right) Change in EFN secretion on day 2 relative to day 1 (a value of +2 indicating a 2-fold-higher secretion on day 2 than on day 1). Asterisks indicate significant (∗∗∗, P < 0.001; ∗∗, P < 0.01; ∗, P < 0.05) differences in EFN secretion on day 2 as compared with day 1 as tested by paired t tests within each leaf age class and treatment (n.s., not significant; n.d., not determined). Bars marked by different letters within the same leaf age group are significantly different (P < 0.05; LSD post hoc analysis conducted on effects of treatment separately for each leaf group after univariate ANOVA). See SI Fig. 6 for detailed results of headspace analyses and Table 1 for identity of volatile compounds.

