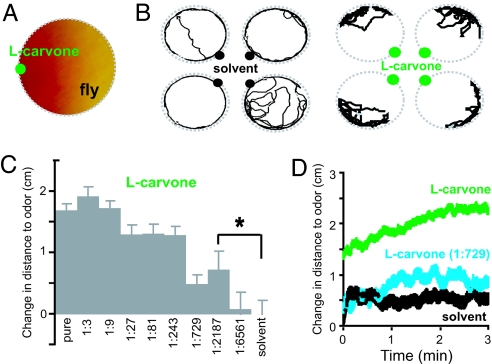
Fig. 2.
Odor avoidance in the stationary odor source assay. (A) Schematic of the assay with pH-sensitive paper showing odor distribution 40 sec into the experiment (see SI Fig. 8B). (B) Example tracks of four animals (3 min) for paraffin oil solvent (Left) and l-carvone (Right) (see also SI Movies 2 and 3). (C) Concentration dependence of responses to l-carvone. Distance to odor is normalized to zero for the behavior produced by solvent (mean ± SEM; n = 37–208 per odor; total n = 703). Distance to odor differs from solvent at the 1/2,187 dilution (∗, P < 0.05, unpaired t test). (D) Temporal profile of distance to odor was plotted by using data from C with solvent (black), pure l-carvone (green), and l-carvone diluted 1:729 (cyan). The change in distance to odor compared with the start of the experiment is shown.

