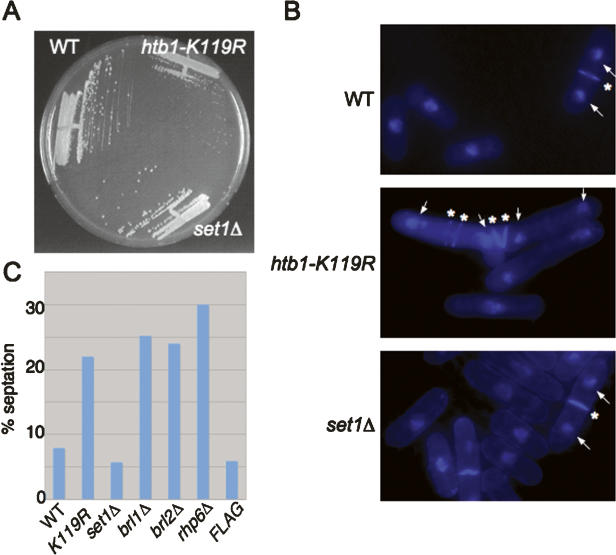
Figure 3.
Functional divergence of H2Bub and H3K4me. (A) The indicated strains were streaked onto YES media and grown for 3 d at 30°C. (B) The indicated strains were grown to log phase in YES media, fixed, stained with DAPI and calcofluor, and photographed. For representative cells in each panel, white arrows denote DAPI-stained nuclei and white asterisks denote calcofluor staining septa. (C) The indicated strains were grown to log phase in YES media, fixed briefly, and stained with calcofluor. Percentages are based on counts of 100–200 cells.

