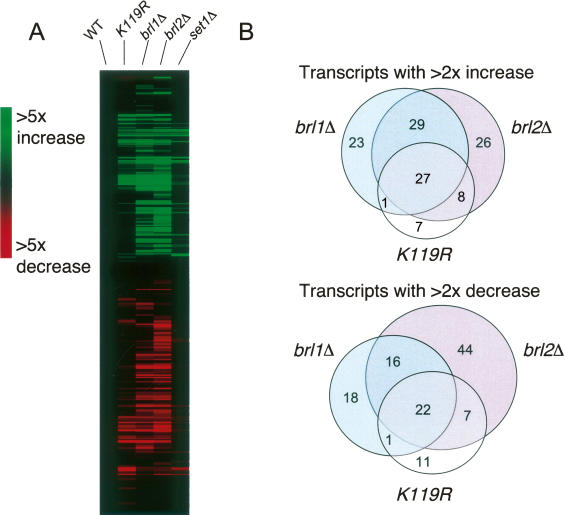
Figure 5.
Gene expression microarray analysis of mutants defective in H2Bub and H3K4me. (A) Transcripts whose levels were altered by at least twofold in one or more of the mutants were clustered using a hierarchical clustering algorithm. Shown is a representative cluster diagram from one of three independent experiments. Values from a wild-type control strain were subtracted from all data sets (WT column). (B) Venn diagrams showing overlap between htb1-K119R, brl1Δ, and brl2Δ data sets.

