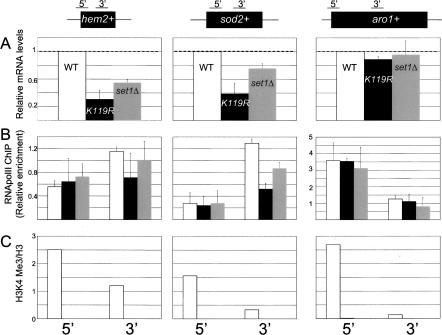
Figure 6.
ChIP analysis of individual genes regulated by htb1-K119R and set1Δ. (A) Total RNA isolated from each strain was analyzed by Q-RT–PCR using the 3′ primer pair for each gene indicated at the top. The data are represented as mRNA levels relative to the wild type, with wild-type levels arbitrarily set to 1 (denoted by dotted lines). Error bars denote standard deviations derived from at least two independent RNA isolations. (B) ChIP for RNA polII was performed on each strain as described in Materials and Methods. Data are expressed as enrichment relative to a region of the control gene cdc25+. Error bars denote standard deviations from at least two experiments. The primer pairs at the bottom of the figure correspond to the regions of each gene diagrammed at the top. Bar colors are as in A. (C) ChIP for H3K4me3. Primer pairs for PCR are denoted at the bottom. Data are representative of two to three independent experiments and are expressed as in B, except they are further normalized to enrichment in total histone H3 immunoprecipitations done in parallel. Bar colors are as in A.

