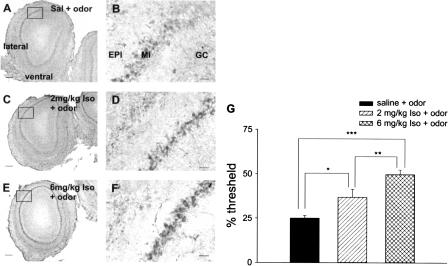
Figure 2.
Drug condition correlation of cAMP expression visualized by immunohistochemistry. Immunohistochemical label of cAMP in the olfactory bulbs of pups exposed to peppermint odor paired with either saline (A,B), 2 mg/kg Iso (C,D), or 6 mg/kg Iso (E,F). (B,D,F) Higher magnifications of regions indicated in A, C, and E, respectively. cAMP expression was especially evident in mitral cells in B, D, and F and tended to increase in density with the higher isoproterenol dose. Scale markers in A, C, and E: 200 μm; in B, D, and F: 25 μm. (G) The percentage (%) threshold of cAMP immunohistochemical staining of mitral cells. The 2 mg/kg Iso + odor group expressed significantly higher cAMP than the saline + odor group. cAMP in the 6 mg/kg Iso + odor group was significantly higher than either the 2 mg/kg Iso + odor group or the saline + odor group. One-way ANOVA F(2,18) = 15.92, P < 0.001. The measurements were obtained from olfactory bulbs of animals sacrificed at 10 min after odor presentation. N = 7 for each group. (Iso) Isoproterenol, (EPl) external plexiform layer, (Mi) mitral cell layer, (GC) granule cell layer.

