Figure 1.
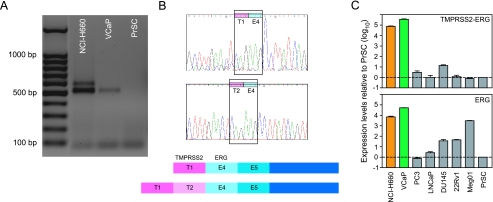
Characterization of TMPRSS2-ERG fusion and ERG expression in the NCI-H660 prostate cancer cell line. (A) RT-PCR using a forward primer in exon 1 of TMPRSS2 and a reverse primer in exon 6 of ERG revealed two transcripts of TMPRSS2-ERG fusion in NCI-H660 (first lane). For comparison, VCaP expressed only one fusion transcript (second lane), whereas normal PrSCs did not harbor TMPRSS2-ERG fusion (third lane). (B) The identity of the fusion transcripts was verified by sequencing. The shorter transcript consisted of TMPRSS2 exon 1 (T1) fused to ERG exon 4 (E4). This transcript was also found in the VCaP cell line. The longer transcript was identified as TMPRSS2 exons 1 and 2 (T1 and T2), fused to ERG exon 4 (E4). Upper panel: sequencing profiles of T1-E4 and T2-E4 transcripts. Lower panel: corresponding schemes of the two fusion types. (C) Real-time qPCR for TMPRSS2-ERG expression (upper panel) and ERG expression (lower panel) on several cancer cell lines. The standard (PrSCs) was expressed as 1 (dashed line). Orange bars correspond to TMPRSS2-ERG fusion through deletion in NCI-H660, leading to a ∼ 6 x 10³-fold overexpression of ERG. Green bars correspond to TMPRSS2-ERG fusion in VCaP, leading to a ∼ 5 x 10⁴-fold overexpression of ERG. Grey bars correspond to the other prostate cancer cell lines tested (PC3, LNCaP, DU145, and 22Rv1) that do not harbor TMPRSS2-ERG fusion and show baseline or moderately elevated ERG expression. Meg01 is a leukemia cell line without TMPRSS2-ERG fusion, but with overexpression of ERG (∼ 3 x 10³-fold), which served as a positive control for ERG expression.

