
Figure 3.
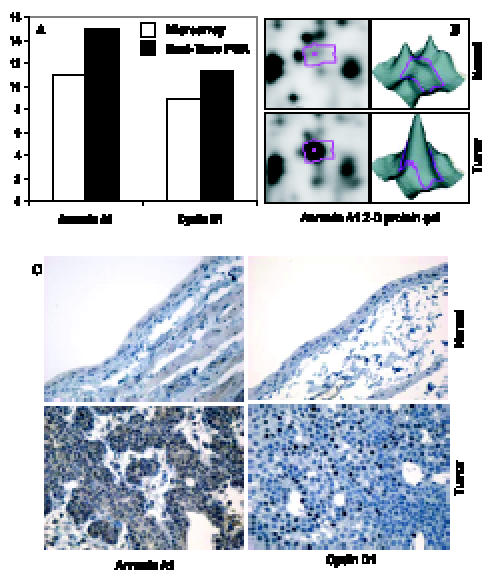
Confirmation of differentially expressed genes for both RNA and protein levels. (A) Comparison of fold change produced by microarray with the relative expression ratio obtained from RT-PCR. (B) 2D protein gel electrophoresis indicates that annexin A1 protein is overexpressed in rat bladder cancers. (C) IHC suggests that both annexin A1 and cyclin D1 are overexpressed in rat bladder cancers.