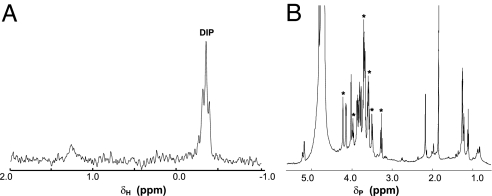
Fig. 7.
NMR spectra of A. pernix cell extracts. (A) 31P NMR (202.2 MHz) spectrum of an ethanol extract of A. pernix JCM 9820. (B) 1H NMR (202.2 MHz) spectrum of the same extract. 1H resonances belonging to DIP (determined from a TOCSY spectrum) are indicated by asterisks; other resonances in this extract in the region of DIP belong to mannosylglycerate.

