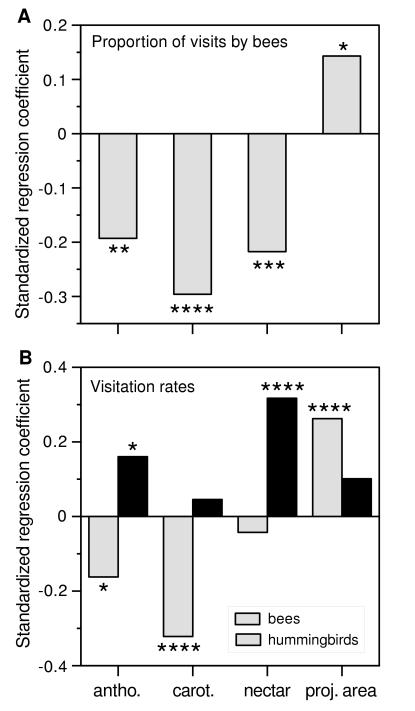
Figure 2.
Contribution of floral traits to pollinator visitation, as determined by multiple regression analysis (antho., petal anthocyanin concentration; carot., petal carotenoid concentration; nectar, nectar volume per flower; proj. area, projected area of petals). Bars give the standardized regression coefficients; ★, P < 0.05; **, P < 0.01; ***, P < 0.001; ****, P < 0.0001. n = 228 F2 plants for all analyses. (A) Multiple regression of floral traits on the proportion of visits by bees (F = 24.2, P < 0.0001, R2 = 0.31). (B) Multiple regression of floral traits on the mean daily visitation rates by bees (F = 22.1, P < 0.0001, R2 = 0.28) and hummingbirds (F = 13.7, P < 0.0001, R2 = 0.20).

