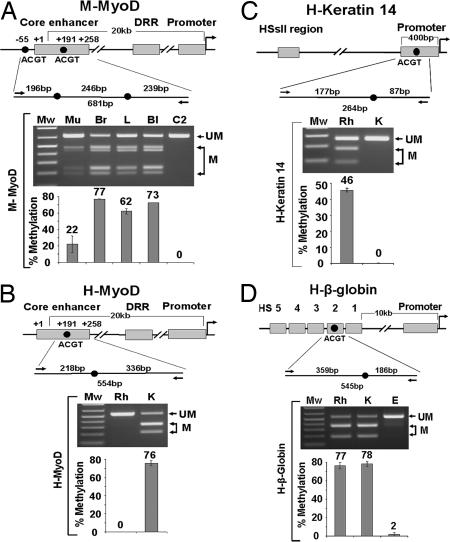
Fig. 2.
Analysis of tissue-specific DNA methylation in mouse and human tissues and cell lines. (A–D Top) Schematic drawings of regulatory regions of the genes. (A–D Middle) The regions analyzed, enlarged to show the HpyCH4IV recognition sites (ACGT) examined (black circles), bisulfite-specific primers for PCR (black arrows), and the sizes of HpyCH4IV cleaved PCR products (above the line) and uncleaved PCR products (below the line). (A–D Bottom) COBRA methylation analysis of the ACGT sites of the genes studied: uncleaved and cleaved PCR products visualized by gel electrophoresis (labeled as UM and M, respectively), and the bar graphs showing the percentage of methylation in the corresponding lane above. (A) The mouse MyoD core enhancer. Mu, mouse muscle; Br, brain; L, liver; Bl, blood; C2, C2 myoblasts. (B) The human MyoD core enhancer. (C) The human keratin-14 promoter. (D) The human β-globin HS2 locus. Rh, human rhabdomyosarcoma muscle cells (RH30); K, primary keratinocytes; E, erythroblasts (TF-1 cells).

