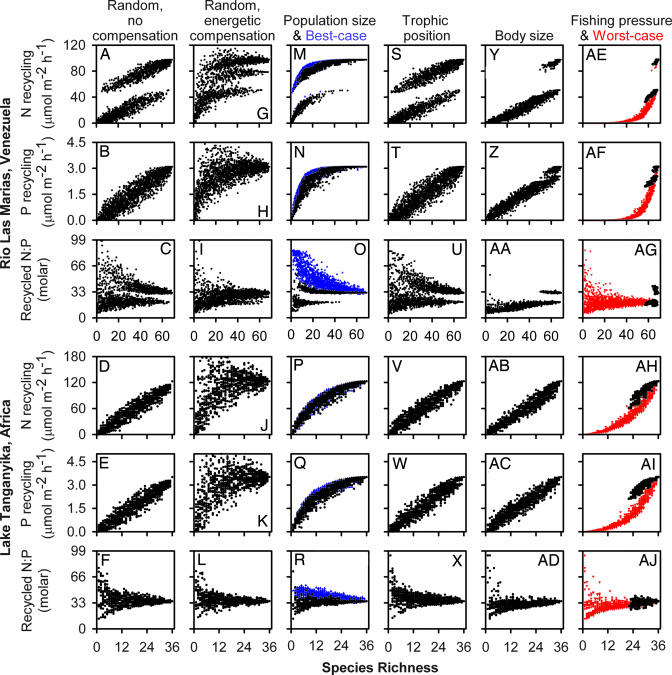
Fig. 1.
Effects of extinctions on nutrient recycling by fish in RLM and LT. Shown are 25 simulations of random extinctions without (A–F) or with (G–L) compensation by surviving species, and nonrandom extinctions reflecting increasing risk with small population size (M–R), high trophic position (S–X), large body size (Y–AD), and observed fishing pressure (AE–AJ). For comparison, best- (M-R, blue) and worst-case (AE–AJ, red) scenarios are indicated. A few results exceeded the maximum y axis value in C, H–K, U, and AG. Note bifurcating (e.g., A and C) and trifurcating (G) patterns associated with loss of Prochilodus mariae, which dominates N recycling in RLM.

