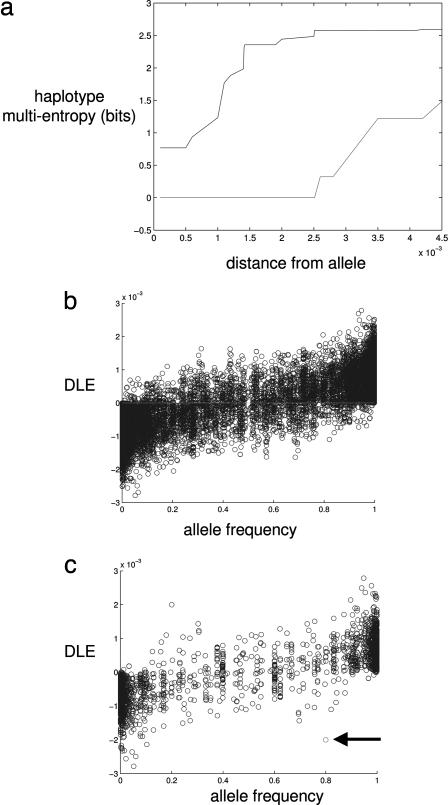
Fig. 6.
Monte Carlo simulation of haplotypes. (a) The conditional multientropy of the adjacent SNPs is plotted for a particular locus where the minor allele (lower curve) had a frequency of 0.19 and the major allele (upper curve) had a frequency of 0.81. The unit of distance is measured in rescaled base pairs. (b) Plot of the DLE values versus frequency of each allele. One thousand Monte Carlo genome samples of size 250,000 base pairs were generated. The mutation rate was set to produce 8,000 SNPs, and the recombination rate was set to 1 cM Mb−1. (c) Selected allele (indicated by arrow) underwent a selective advantage per copy per generation of 0.1

