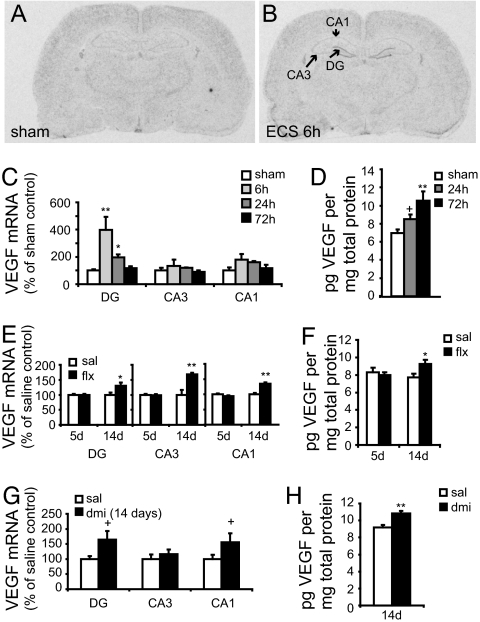
Fig. 1.
Hippocampal VEGF expression is increased by fluoxetine, desipramine, and ECS. VEGF mRNA expression was determined by ISH analysis. (A and B) Representative autoradiograms illustrate induction of VEGF mRNA in the dentate gyrus granule cell layer (DG), CA3 and CA1 pyramidal cell layers of the hippocampus 6 h after sham (A) or ECS treatment (B). The graphs show optical density values as a percent of sham-handled controls. (C) The time course of VEGF mRNA induction was quantified in rats receiving a single ECS [DG, F(3, 12) = 7.612, P < 0.01; CA3, F(3, 12) = 0.608, n.s.; CA1, F(3, 12) = 1.970, P > 0.05]. (D) Quantification of VEGF protein levels in whole hippocampus homogenates, determined by ELISA after a single ECS [F(2, 14) = 6.965, P < 0.01]. (E) VEGF mRNA expression was quantified following 5 or 14 days of fluoxetine treatment [FLX-14d: DG, F(1, 6) = 6.211, P < 0.05; CA3, F(1, 6) = 15.272, P < 0.01; CA1, F(1, 6) = 32.514, P < 0.01; FLX-5d: DG, F(1, 8) = 0.001, n.s.; CA3, F(1, 8) = 0.093, n.s.; CA1, F(1, 8) = 2.206, n.s.]. (G) VEGF mRNA induction by 14 days of desipramine [DMI-14d: DG, F(1, 10) = 4.261, P = 0.06; CA3, F(1, 10) = 0.532, n.s.; CA1, F(1, 10) = 2.901, P = 0.1]. VEGF protein levels after fluoxetine (F) or desipramine (H) treatment [FLX-14d, F(1, 8) = 5.247, P ≤ 0.05; FLX-5d, F(1, 8) = 0.231, n.s.; DMI-14d, F(1, 10) = 16.042, P < 0.01; n = 4–7 per group in each experiment]. ∗, P ≤ 0.05; ∗∗, P ≤ 0.01; +, P ≤ 0.1; n.s., P > 0.1.

