
Figure 3.
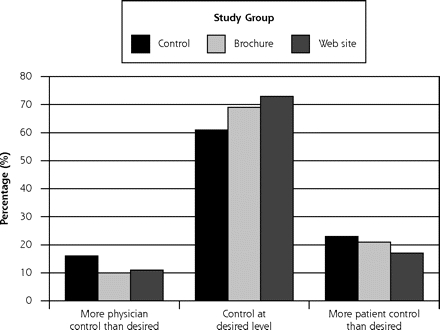
Patients’ actual and desired locus of decision-making control (N = 431).
Note: The figure shows the level of concordance between the locus of decision-making control that patients reported and the locus of control that they desired. Concordance did not differ between the 3 study groups (P1 = .41). Participants overall were more likely to report “More patient control than desired” than “More physician control than desired,” however (19% vs 11%, P2 = .003).