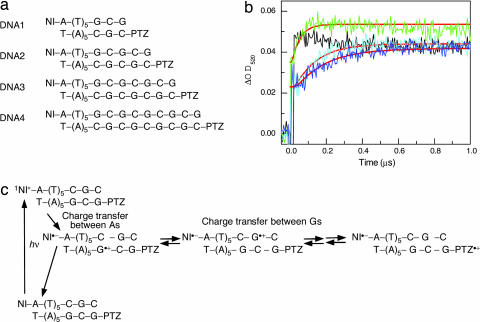
Fig. 1.
CT through (GC)n sequences. (a) Sequences of NI- and PTZ-modified DNAs. (b) Time profiles of the transient absorption of PTZ•+ monitored at 520 nm during the 355-nm laser flash photolysis of an Ar-saturated solution of NI- and PTZ-modified DNAs at 10°C for DNA1 (black), DNA2 (green), DNA3 (cyan), and DNA4 (blue), respectively. The smooth red curves superimposed on the rise curves are the fit to the kinetic model depicted in Fig. 2a. (c) Kinetic scheme for photo-induced one-electron oxidation of adenine and subsequent CT between guanines.

