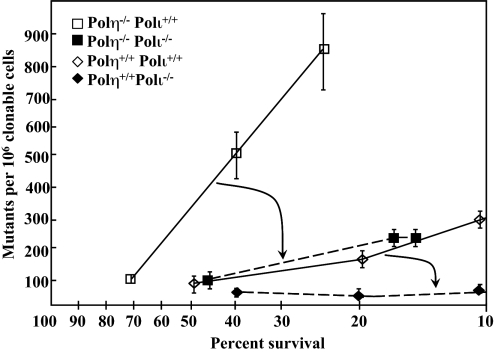
Fig. 2.
Frequency of TG-resistant (TGr) clones as a function of survival after UV irradiation. Cells were plated on three 150-mm-diameter dishes at a density of 104 cells per dish to determine mutant frequency or at cloning density to determine survival. After attachment, plates were irradiated with UV fluences estimated from the data in Fig. 1 to yield 20–40% survival. The actual survival in the mutagenesis experiments was determined as in Fig. 1 and plotted on the x axis. The corresponding mutant frequency at each survival is plotted on the y axis. Each point represents the mean of three independent dishes at the indicated survival, ±1 SD. Mutant frequency is defined as the number of TGr clones per million clonable cells. Each data point represents independent experiments in which 2–4 × 10⁶ surviving cells were selected after UV irradiation and an 8- to 9-day expression period. The data have been corrected for cloning efficiency on the day of selection, and the spontaneous background mutant frequency (1 × 10⁻⁵) has been subtracted. The arrows indicate the reduction in mutant frequency when Polι is disrupted in the pol η-deficient background (larger arrow) and in the pol η-proficient background (smaller arrow).

