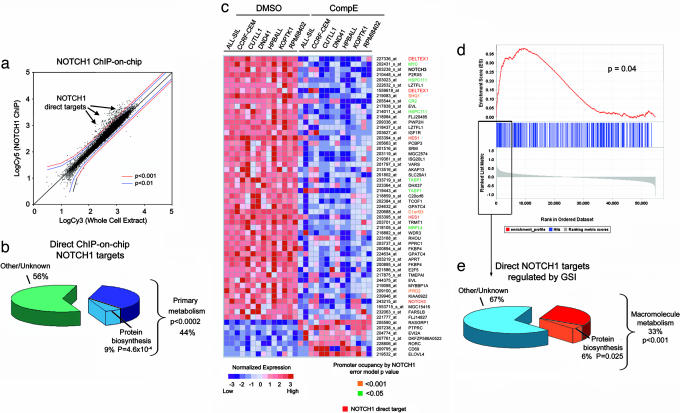
Fig. 3.
NOTCH1 is a direct regulator of genes involved in cell growth and metabolism. (a) Scatter plot showing the combined results of three independent ChIP-on-chip experiments with the N1-TAD antibody recognizing the transactivation domain of NOTCH1 in HPB-ALL cells. The log fluorescence values for control DNA labeled with Cy3 are plotted on the x axis, and those for the NOTCH1 IP DNA labeled with Cy5 are plotted on the y axis. Promoter sequences bound by NOTCH1 (arrowheads) are shifted to the upper left side from the diagonal. (b) Functional classification of NOTCH1 direct targets identified by ChIP-on-chip (P < 0.0001). (c) Top gene expression changes induced by GSI in T-ALL cell lines ranked by signal-to-noise ratio. Heat map represents color-coded expression levels for each sample with respect to mock treatment controls. Previously known NOTCH1 direct target genes and genes identified on ChIP-on-chip analysis are highlighted. (d) Graphic representation of the GSEA enrichment score and distribution of NOTCH1 occupied promoter genes (binding P value <0.0001) along the rank of GSI-regulated transcripts. (e) Annotation of NOTCH1 direct target genes along the top GSI-regulated transcripts ranked by signal-to-noise ratio.

