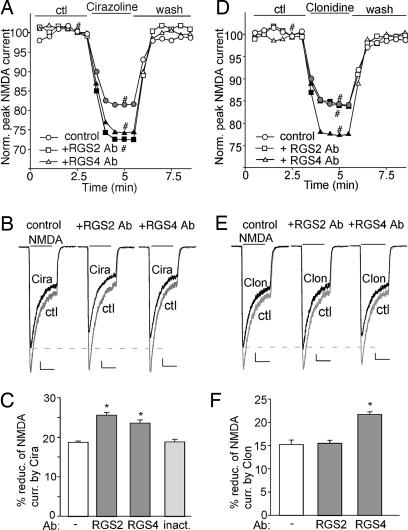
Fig. 5.
Different RGS proteins modulate the effect of α1-ARs or α2-ARs on NMDAR currents. (A and D) Plot of normalized peak NMDAR currents showing the effect of cirazoline (A) or clonidine (D) in neurons dialyzed with 4 μg/ml anti-RGS2 or anti-RGS4 antibody. (B and E) Representative current traces (at time points denoted by #). (Scale bars: 100 pA, 1 s.) (C and F) Cumulative data (mean ± SEM) showing the percentage reduction of NMDAR currents by cirazoline (C) or clonidine (F) in the absence or presence of different RGS antibodies. ∗, P < 0.01, ANOVA.

