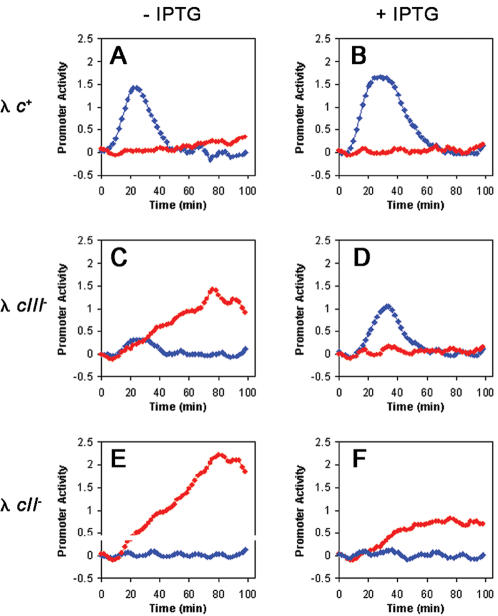
Figure 6. CIII levels effect on CII and Q activity in vivo.
CII activity is reported by pE-gfp fusions (blue diamonds), whereas Q activity is reported by pR‘-tR‘-gfp fusions (red circles). Promoter activity is given as a function of time of infected cultures carrying the pCTCIII plasmid in the presence or absence of 0.1mM IPTG (B, D, F or A, C, E respectively) with λc+ (A, B), λcIII− (C, D), and λcII− (E, F). All measurements were carried out as described in the materials and methods at a MOI of 6.

