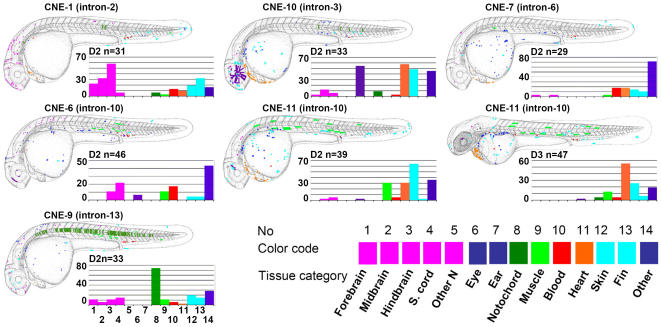
Figure 3.
Sites of GFP Expression Induced by GLI3-Associated CNEs in Zebrafish Embryos. Upregulation of GFP by individual GLI3-associated CNEs (indicated by name and location in a GLI3-intron) depicted in schematic representations of day two, 24–33 hpf (D2) or day 3 (D3) embryos. N = the total number of positive embryos per CNE. Categories of cell type that were positive for a given element are color coded, and each dot represents a single GFP positive cell. These are mapped onto camera lucida drawings of the zebrafish embryo, and the overall results are overlaid. The percentage of positive embryos that show expression in each color coded tissue category are shown on the bar charts.

