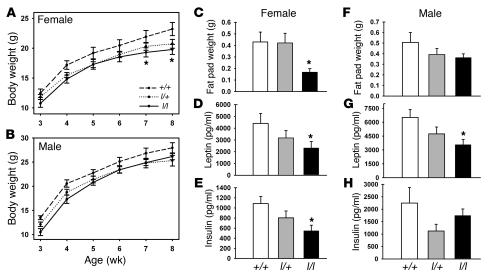
Figure 2. Leanness in l/l mice.
(A and B) Mice of the indicated sex and genotype were weighed weekly from the time of weaning until the age of 8 weeks. No difference between curves by repeated measures ANOVA; *P < 0.05, l/l versus +/+ animals for pairwise comparisons (ANOVA) at indicated age. (C–H) Data regarding adipose tissue weight and hormone levels from 8-week-old female +/+ and l/l mice from A and B. (C–E) Female mice. (F–H) Male mice. All values represent mean ± SEM. *P < 0.05 versus +/+ mice, by ANOVA.

