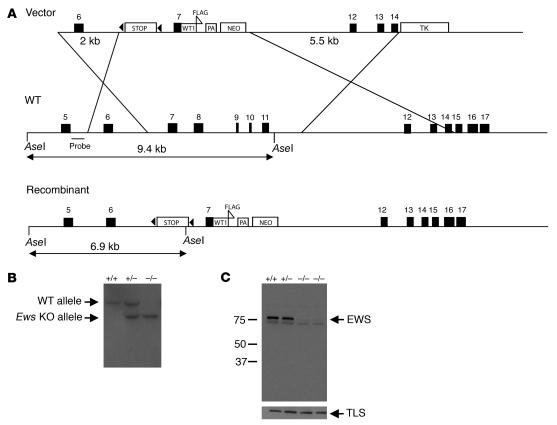
Figure 1. Inactivation of Ews by gene targeting.
(A) Scheme for Ews targeting strategy. The triangles indicate loxP sequences flanking the stop cassette. WT1, WT1 cDNA; PA, poly(A) sequence. The probe used for Southern blot analysis is indicated. (B) Southern blot analysis of AseI-digested tail DNA. Wild-type (9.4-kb) and targeted (6.9-kb) alleles are marked. (C) Western blot analysis of EWS and TLS using whole-cell extracts isolated from MEFs. Ews genotype and the molecular weight markers (kDa) are indicated.

