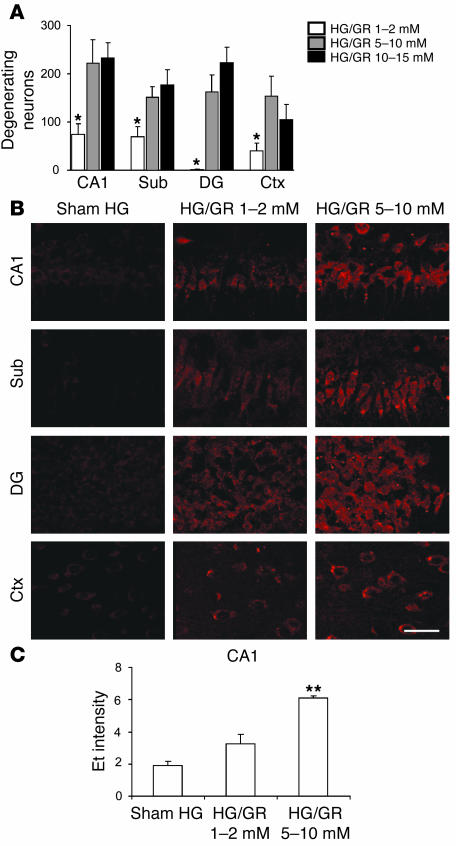
Figure 5. Effects of reperfusion glucose concentrations on neuronal superoxide production and survival.
(A) Effects of reperfusion blood glucose concentrations on neuronal survival after HG/GR. Data are mean + SEM; n = 7–10; *P < 0.01 versus the 5–10 mM GR group in each region. (B) Neuronal superoxide production as imaged by Et fluorescence in rat brain hippocampal sections after HG and GR at the indicated blood glucose concentrations. Sham HG rats received glucose infusions immediately after insulin to prevent HG. Scale bar: 100 μm. (C) Et signal intensity was quantified for the CA1 region as described for Figure 1A. Data are mean + SEM; n = 4; **P < 0.05.

