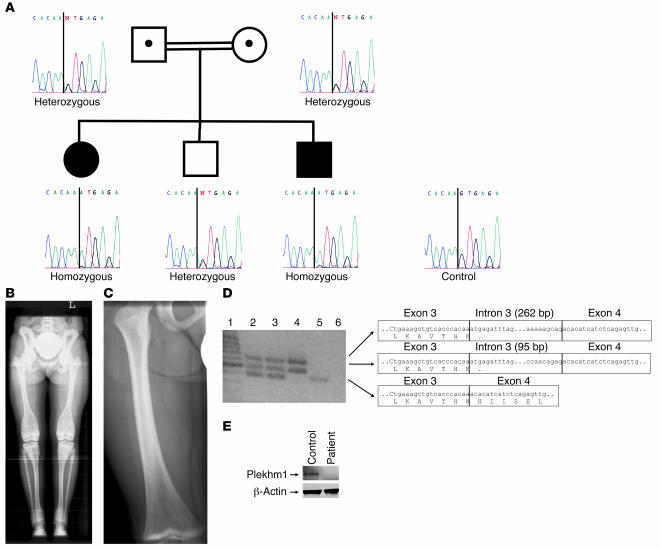
Figure 3. Mutation analysis of a family with autosomal-recessive osteopetrosis.
(A) Sequencing analysis showed a homozygous G→A transition at position +1 of intron 3 of the PLEKHM1 gene in the patient and the youngest brother. (B) Full-leg radiograph from the affected patient: cortical sclerosis of the pelvic bones, particularly at the iliac wings. Note the band-like sclerosis of the vertebral endplates (rugger jersey spine) and the inhomogeneous sclerosis at the metadiaphyses of the distal femora, tibiae and fibulae, and proximal fibulae and tibiae. Also note the broadening of the involved segments of the long bones (“Erlenmeyer flask” deformity). (C) Radiograph of the right femur of the youngest brother at 2 years of age showing the presence of a dense metaphyseal band at the distal metaphysis. (D) RT-PCR amplification across exons 3–4 of the PLEKHM1 gene. The sequence of the corresponding PCR products is presented. Lane 1, size marker; lane 2, father; lane 3, mother; lane 4, affected patient; lane 5, unrelated control; lane 6, blank. (E) Western blot analysis demonstrated that the Plekhm1 protein was not present in osteoclast lysates from the affected patient, in contrast to lysates from a healthy individual.

