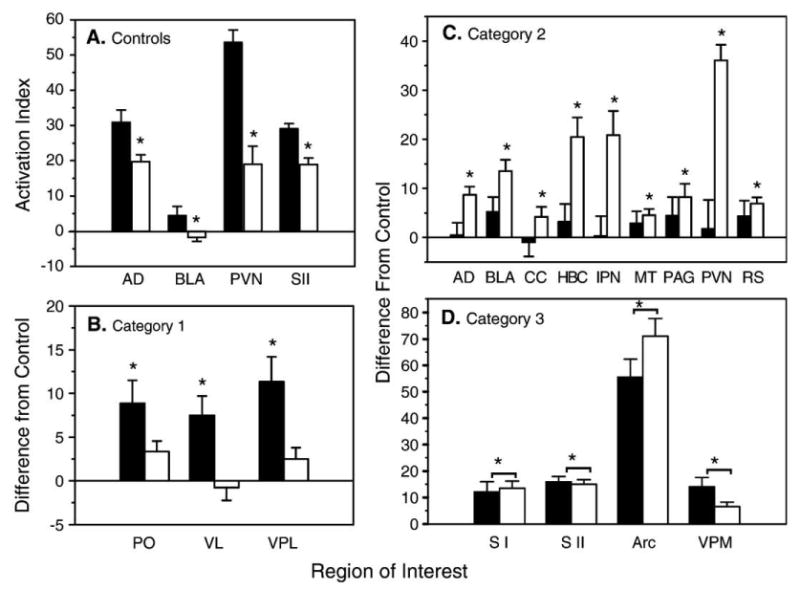
Fig. 2.

Average bilateral level of activation in basal (unstimulated) regional cerebral blood flow in Long–Evans (LE) and Sprague–Dawley (SD) rats. The filled bars represent the LE groups, and the open bars represent the SD groups in all panels. (A) The data shown are for ROIs exhibiting a significant difference in activation between the LE and the SD control (un-operated) groups. The relative levels of activation are expressed as AI, the mean percent difference from total brain activity. The asterisk (*) indicates a significant difference in activation between the two control groups (P < 0.05, ANOVA). (B) The data shown are category 1 ROIs, those exhibiting a significant increase in activation in only the LE SCI group when compared to the same-strain control group. (C) The data shown are category 2 ROIs, those exhibiting a significant increase in activation in only the SD SCI group when compared to the same-strain control group. (D) The data shown are category 3 ROIs, those exhibiting a significant increase in activation in both the SD and LE SCI groups when compared to the same-strain control group. The data displayed in panels (B–D) are expressed as the difference from the control, calculated by subtracting the control mean from the same-strain SCI group for each ROI. The asterisks (*) indicate a significant difference from the same strain control group (P < 0.05, ANOVA).
