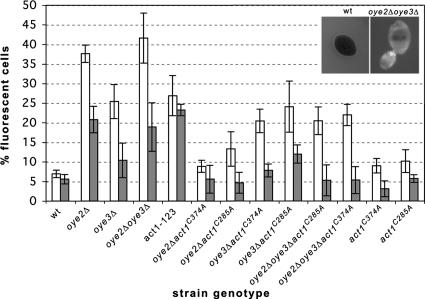
Figure 1.
Actin oxidation in oyeΔ cells leads to ROS accumulation. Logarithmically growing cells were stained for 3.5 h with the ROS-sensing dye H2DCFDA, and the percentages of fluorescent cells was determined. □, rho+ cells; ▩, rho0 cells. The averages and SDs reported are for three to four experiments. Left inset, example of an ROS-negative wild-type cell; right inset, example of an ROS-positive oyeΔ cell.

