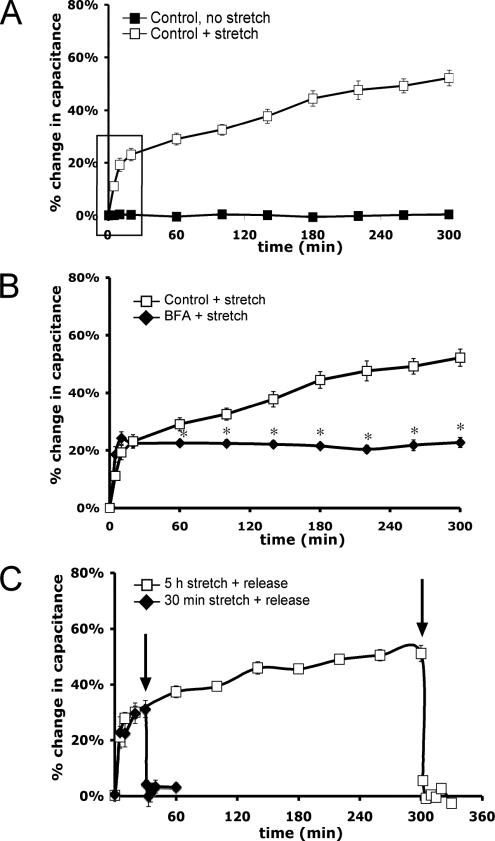
Figure 1.
Characterization of the response to uroepithelial stretch. (A) Isolated rabbit uroepithelium was left unstretched or exposed to ∼1 cm H2O pressure (+ stretch) in an Ussing stretch chamber, and changes in membrane capacitance were measured. The box indicates the early phase increase in surface area upon stretch. (B) Tissue was pretreated with 5 μg/ml BFA for 10 min before stretching the tissue in the continued presence of BFA. *, Statistically significant difference (p < 0.05) relative to stretched samples. (C) Tissue was stretched for 30 min or 5 h and then the added Krebs' buffer was removed (indicated by arrows), releasing the stretch stimulus. Mean changes in capacitance ± SEM (n ≥ 3) are shown.

