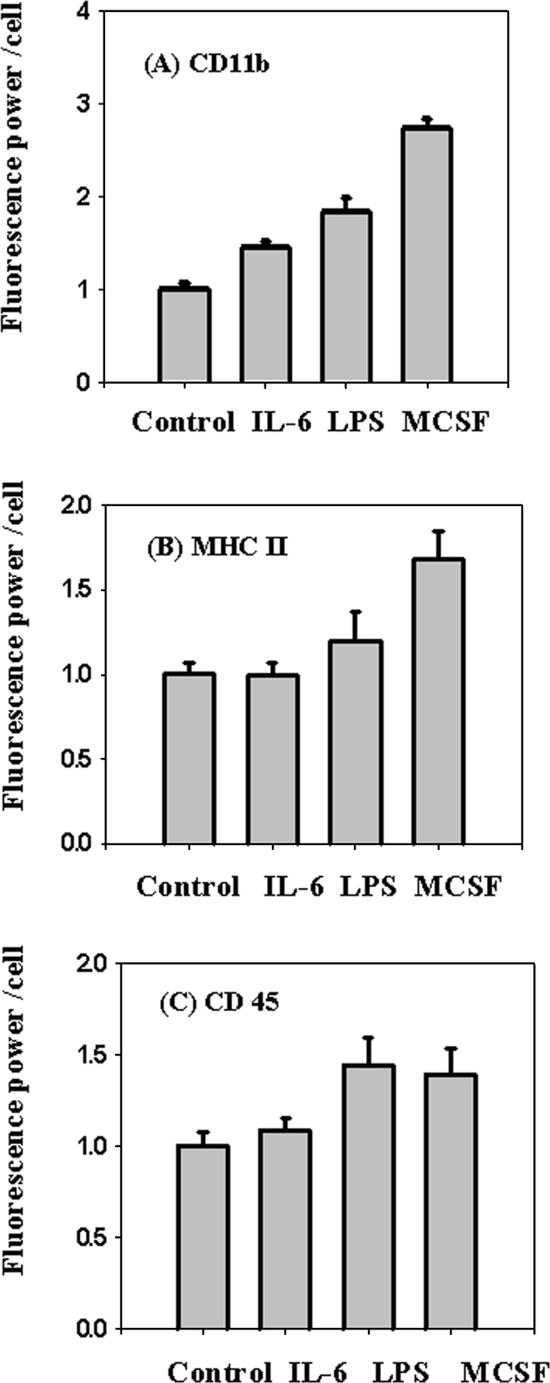
Figure 2.
Expression of cell surface markers on microglia. Microglia were treated with 200 ng/ml IL-6 for 16 h, 200 ng/ml LPS for 16 h, or 25 ng/ml MCSF for 5 d, and expression of cell surface markers CD11b, MHC II, and CD45 were measured using digital imaging of immunofluorescence. The figure shows the fluorescence power (arbitrary units) per cell for the treated and untreated cells. CD 11b (A), MHC II (B), and CD 45 (C). Error bars are SEM from six different experiments done on six different days.

